Live
- Sanjay Takale set to become first Indian driver at Dakar in cars category
- ED raids ex-RTO constable Saurabh Sharma and associate builder
- MHCVs, tractor sales in India to report better volumes post-festive period: Report
- Storm Elena strikes Greece, bringing traffic chaos, flooding
- Sachin Tendulkar accepts Honorary Cricket Membership of Melbourne Cricket Club
- India dominates IPO market with 200 issues in Asia Pacific in 2024, China falters
- WHO Chief calls for release of UN staff following negotiation with Houthis
- AP Ministers and MPs condoles the death of former PM Manmohan Singh
- 7 Must-Watch OTT Releases on December 27, 2024: Bhool Bhulaiyaa 3, Singham Again & More
- NTPC, Adani Enterprises, PNB among top firms poised to gain from Nifty rejig
Just In
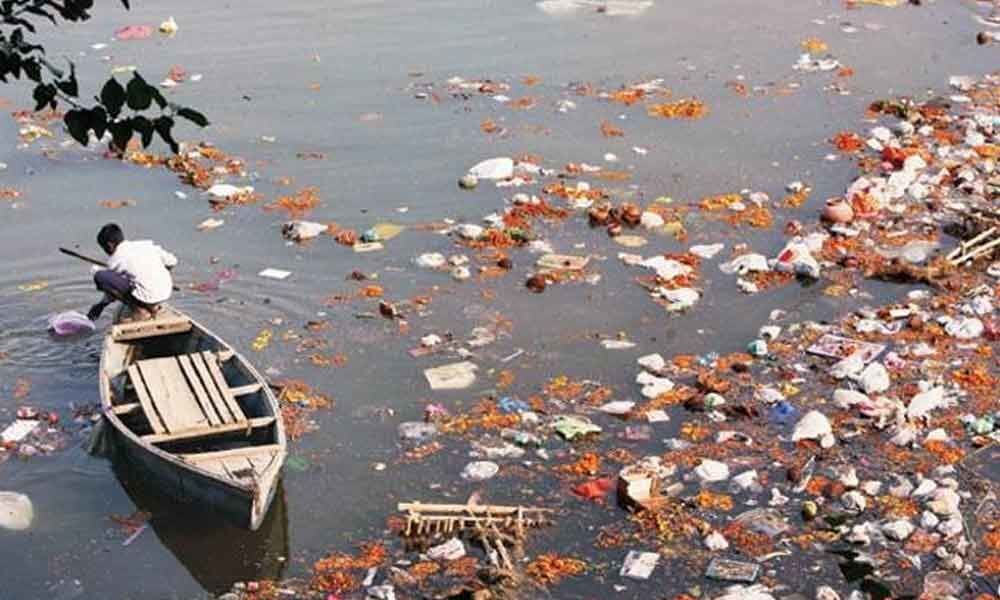
Boat ride can tell how polluted India's major rivers are


New Delhi: On a pleasant afternoon last week, scientists sailed down a section of the Yamuna on a boat equipped with cutting edge sensors to map...
New Delhi: On a pleasant afternoon last week, scientists sailed down a section of the Yamuna on a boat equipped with cutting edge sensors to map pollution hotspots and monitor water quality in real time instead of relying on time-intensive and expensive lab measurements. An hour into the ride that started from the Nigambodh Ghat here, the sensors could point to exact locations where effluents enter the river as well as map levels of acidity, dissolved oxygen and organic matter among other factors that make the river waters unfit for not just humans but also aquatic life.
The boat ride was part of the Water-to Cloud project developed by researchers at the Tata Centre for Development (TCD), University of Chicago, and the Indian Institute of Technology (BHU), Varanasi, in collaboration with International Innovation corps. A few days before the ride on the Yamuna, on which the team has been working more than a year, the researchers went down the Ganga in Varanasi in Uttar Pradesh to demonstrate the efficacy of the system.
The aim of the project, the scientists said, is to provide a holistic water quality monitoring platform and pinpoint the hotspots of pollution in major Indian water bodies, including the Ganga and Yamuna and important lakes, using sensors that send real time data to a hand-held device in the form of easily readable maps. "The project explores the benefits of continuous, real-time, and in-situ water quality monitoring system that would act as an early warning system," Priyank Hirani, Water-to-Cloud programme manager and team lead, told PTI.
"The system uses powerful data visualisations in the form of heat maps which can be used to dynamically monitor, predict, and regulate water quality," Hirani explained. According to him, current methods of river water quality monitoring in India rely heavily on lab measurement, which is time-intensive and expensive and is done on a per sample basis. Moreover, lab analyses from point measurements may not always give a holistic picture of the health of rivers as they are dynamic ecosystems and require continuous monitoring, he added.
"Our project leverages the benefit of sensor technology, which is becoming more affordable. The sensors, which have a wide range in terms of values they can record, are attached to a boat that goes on a pre-defined route," Hirani said. After the data is recorded real-time, it is downloaded from sensors, cleansed and uploaded to a user-friendly and open-access platform. Under the project, 1,100 time-stamped and geo-tagged data points on an average are available on water pollution in Ganga, Yamuna, Godavari, Brahmaputra, and three lakes in Bengaluru -- Ulsoor, Nagvada and Jakkur.
Of the three rivers, the researchers said Yamuna is the most polluted. There has been no significant improvement in the quality of the water in the river since 2017 when they started the project. To gather data, boats are equipped with multiple submersible automated sensors and set on sail at different times of the day based on a pre-defined route. This time-stamped and geo-tagged data is then filtered and superimposed on geospatial maps to create two-dimensional area heat maps for ease of interpretation and predictive analysis.
Detailed lab analysis is done on a regular basis to support in-situ field measurements. Following curation of the geospatial and temporal water quality data, the project applies mathematical tools to predict the spread of pollution, interpolate sparse data, and identify the specific sources of pollution. "We have been working on the Godavari since 2016. Over the past 15 months, we have been monitoring water quality of the Ganga in Varanasi," said Supratik Guha, principal investigator, Water-to-Cloud project.
The team, which has been working on the Yamuna in Delhi for about 18 months, has collected close to 300,000 data points after conducting over 225 experiments across 11 locations. The researchers said while mapping the river chemistry, it emerged that the level of dissolved oxygen in two stretches of Ganga is often below the standards, and alarmingly low in the Yamuna. When it comes to turbidity, which is a direct result of effluents from urbanised zones, large water bodies monitored in the study, do not fare well, they said.
For Yamuna, the heat map suggests that dissolved oxygen level is below 2, way less than the normal levels. The ppb (parts per billion) levels of tryptophan, an amino acid, as reflected in the heat maps, look very high over a stretch of the river.
The researchers noted that some stretches of Godavari witness turbidity over 100 Nephelometric Turbidity Unit (NTU) . Ideally, turbidity level for surface water should be within 50. In case of Bengaluru's lakes, the level is extremely high, hovering between 400 and 450 NTU. Guha said the continuous real-time monitoring of river water quality helps to regulate and pinpoint pollution sources and identify safe bathing ghats, besides creating hydrological models to quantify pollution load entering a river.

© 2024 Hyderabad Media House Limited/The Hans India. All rights reserved. Powered by hocalwire.com


