Stocks with earnings growth in limelight

Nifty
Nifty scales to a fresh new all-time high of 15,962 during last week
EQUITY market benchmark indices snapped two weeks declined and scaled to a fresh new all-time high of 15,962 during the last week. The Nifty advanced by 233.60 points or 1.49 per cent. The BSE Sensex is up by 1.4 per cent. The Smallcap-100 and Midcap-100 outperformed the benchmark by 4.2 per cent and 1.4 per cent. The Nifty Realty is the top gainer with 8.6 per cent and IT and Metal indices by 2.2 per cent and 2.6 per cent. The Nifty Media and PSU Bank indices are down by 1.3 per cent and 0.3 per cent. The market breadth is almost 1:1 during the week. The FIIs sold Rs 6,923.61 crore, and DIIs bought Rs 5,136.45 crore during the week. The VIX declined by 9.56 per cent to 11.70, which lowest close since 2nd January 2020.
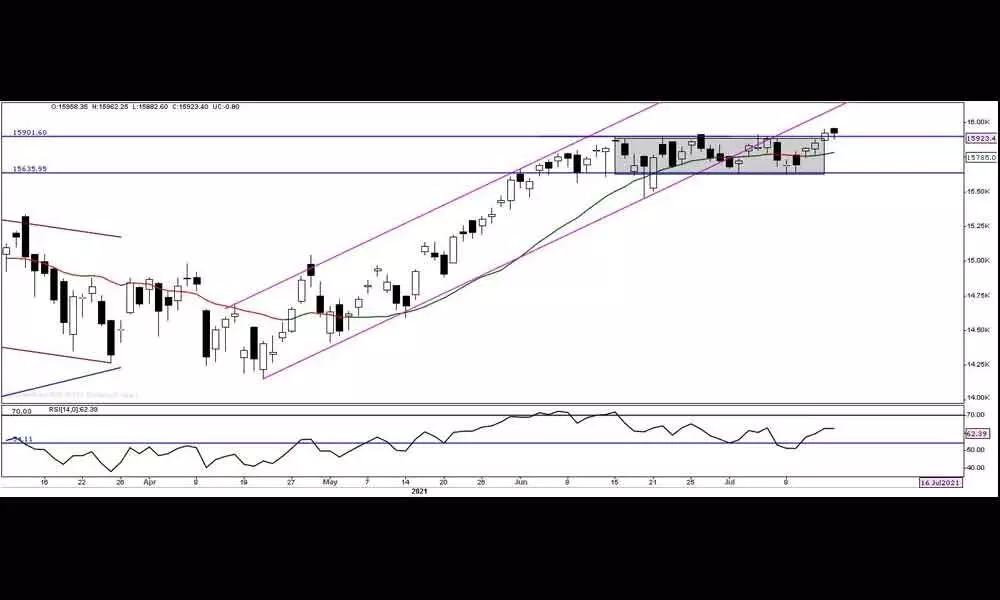
The Nifty finally ended its 22-day long tight flat base and closed above it on a weekly basis. The momentum regained on the upside. The move in the flat base tested support and resistance several times. The index succeeded on the seventh test of resistance. The Breakout sustained for the second day, the faster retracement, and the follow-through day is missing after the Breakout. It closed at a new high, all the moving average is irrelevant now. But, the distance from 200 DMA declined to 12.17 per cent. When it made a new high on 16th February at 15,431, the distance was 28.89 per cent. This is because of lack of sharp retracements. At the same time, the Nifty trading is just 2.48 per cent above the 50DMA. Importantly, the Nifty relative price strength is much below the broader index Nifty 500. The RS line is declining for the past six months. There is a trend line connecting the 16th February high, and 15th June high is showing a resistance around 16,060.
Even though the Breakout is missing a sharper retracement, it is also resilient to the significant decline. In any case, the Nifty sustains above the breakout level (15,900) and 20DMA (15,785), the targets are open to 16,200-300 as we project earlier. As Wednesday is a holiday on the occasion of Bakrid, the option premiums have unattractive levels.
The leading indicator, the RSI is showing a substantial negative divergence on a daily and weekly chart. The price moved higher, made a higher high, the RSI still below the prior swing low. The Weekly MACD shows a flat momentum. But, the daily MACD is about to give a buy signal. The positive directional indicator +DMI is also showing the negative divergence. These indications are concerns for the trend.
The VIX declined 2nd January 2020 level, and historically lowest levels at 1,170. The Implied volatility declined to below 10 levels..
The strategy is to continue the long positions with a trialling stop loss of 15,900-785 and aim for a 16,060 – 16,200 -16,300. Avoid the aggressive positions on both sides. As the chart shows no significant negative tone, it is better to be with a positive bias. Stocks announcing earnings growth in Q1 will be in the limelight and focus on them.
(The author is a financial journalist and technical analyst. He can be reached at [email protected])


