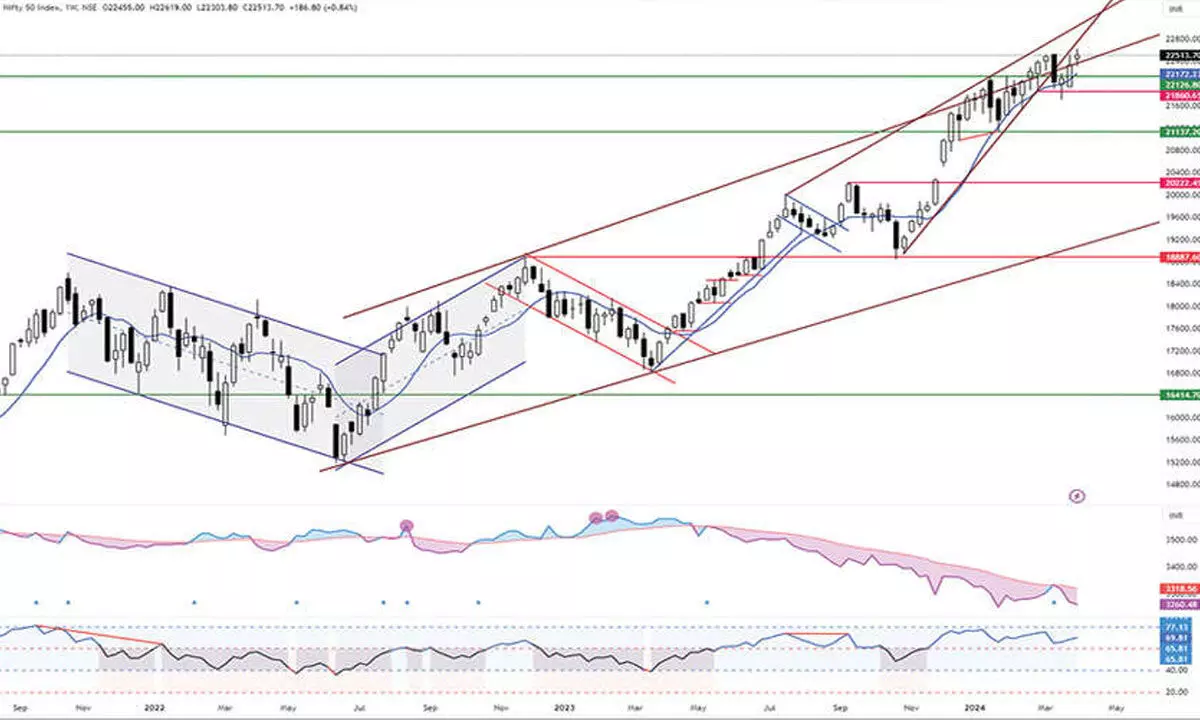
Range-bound consolidation likely

The equity benchmark indices traded with high volatility and registered a new high close weekly
The equity benchmark indices traded with high volatility and registered a new high close weekly. NSE Nifty gained 186.80 points or 0.84 per cent, after trading in the 315-point range. BSE Sensex also gained by 0.80 per cent. The Midcap-100 and Smallcap-100 indices outperformed by four per cent and seven per cent, respectively. The mid-cap index hit a new high. The Nifty Metal and Realty indices were the top gainers with 5.3 per cent and 4.3 per cent. Bank Nifty also registered a new high close on a weekly basis with a 2.9 per cent gain. All other sectoral indices closed higher. During the first week of the new financial year, the FIIS sold Rs3,835.75 crore worth of equities. The DIIs bought insignificantly Rs2 lakh worth of shares.
The Nifty’s performance last week was marked by the formation of a five-week base or 18-day cup pattern. This pattern, along with the higher volumes recorded, validates the breakout. The index also formed a small body candle that resembles an evening star. On Thursday, it registered a highly volatile session and hit a new lifetime high. However, the very next day, it traded within a narrow 101-point range, with the lowest volume in the last month. The index closed negatively for three days in a four-day week, indicating some market indecisiveness. The index is making new highs, but concerns remain, as there are minor incremental highs and major declining moves. Since January 16, the index is advancing with low volume and declining with higher volume, A character that typically indicates a topping formation. The most important concern is the VIX. It declined by 11.65 per cent last to 11.34, the lowest since November 24. Normally, the low VIX is not for an uptrending market. But recently, it lost relevance after its lowest level last November; the index moved impulsively upside, which is not a character.
The Nifty is now 1.54 per cent above the 10-week average, which acted as a support. Out of 11 weeks, it took support for eight weeks in the recent past. Last December, the distance between the index and this key moving was 7.65. The narrower the distance means reversion.
(The author is Chief Mentor, Indus School of Technical Analysis, Financial Journalist, Technical Analyst, Trainer and Family Fund Manager)


