Q4 results to shape market trend

Q4 results to shape market trend
Watch out for companies declaring earnings growth above 20%
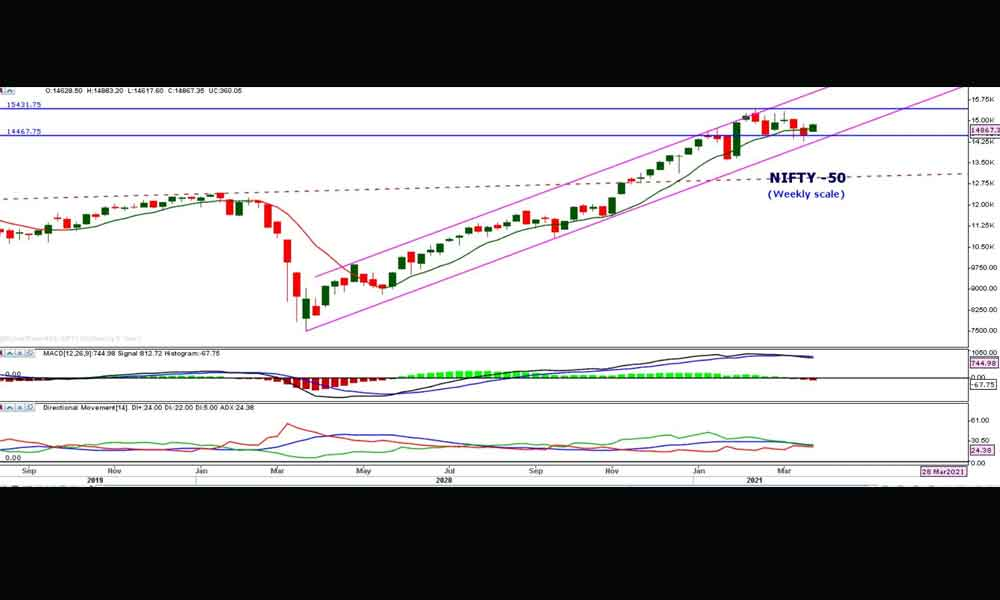
Indian stock market bounced back in a truncated week. It opened with a gap-up and traded within the Tuesday's range. The Nifty advanced by 375.90 points or 2.56 per cent during the week. All the sectoral indices gained. Nifty Metal and PSU Bank Index were top gainers with 8.7 per cent and 4.7 per cent, respectively. Remaining indices gained by 1.2 per cent to 3.2 per cent. Overall market breadth is not encouraging. FIIs invested Rs 1245.22 crore in March. In the three trading sessions last week, Nifty traded in a defined range. It opened with a big gap and sustained the gains until the end on Tuesday and ended with 338 points. But, the following two days of trading, it traded within the range of Tuesday. It tested 14880 level four times in last nine days. This level has become a strong resistance for now.
On a weekly chart, it has made a higher low, which is a positive sign. At the same time, it reclaimed 50 DMA, and 20 DMA is another positive sign. Even though it gained 360 points last week, the MACD histogram showed an increased bearish momentum. All the directional movement indicators, ADX, +DMI and -DMI, are below the 25 level on the weekly chart.
Even on the daily chart, the ADX is below 25 levels, and the -DMI is above the two. This structure is not indicating any great positive strength on the chart. But, the positive thing is, on a 75 minutes chart, Nifty formed an inverted head and shoulders kind of pattern, which is bullish. A close above 14880 is positive and can lead to a sharp upside move. This move can be a 600 point length, and the target is almost the previous lifetime high.
But on the downside, the 20 weekly average at 14230 is strong support. This average line is moving precisely like a trend line drawn from March lows. For next week, it is very difficult to forecast the trend. As long as it sustains above 14880, it will be with a bullish bias. Trading below this level means the consolidation phase will continue mostly within Tuesday's range. A move below 14617 is negative for the market, and it can fill the gap by testing 14500 levels. For a long-term trend, moving below 14230 is a very big negative for the intermediate trend.
The global markets are buoyant as S&P 500 hit an all-time high. But, dollar still trading above 93 levels and the 10 year US bond yields are consolidating for the consecutive week after touching the 14 month high. As we keep mentioning about the inverse relationship between bond yields and equities, let us wait for this historical fact to repeat this time.
Nifty Price-Earning (PE) ratio has changed as the calculation method has changed to consolidated earnings. With this new method, Nifty PE drastically came down from above 40 levels to 33.60. Even this figure is much higher than earlier tops in 2000 and 2008. The Price Book Value ratio remains at a higher level of 4.25. The earnings are due in another one week to ten days. These earnings will play a major role in market trend. Watch them closely for any improvement that will lead to a sharp jump in the stock prices. Watch out for the companies that declare earnings growth above 20 per cent.
(The author is a financial
journalist and technical analyst.
He can be reached at [email protected])


