Market trading on stretched valuations

Market trading on stretched valuations
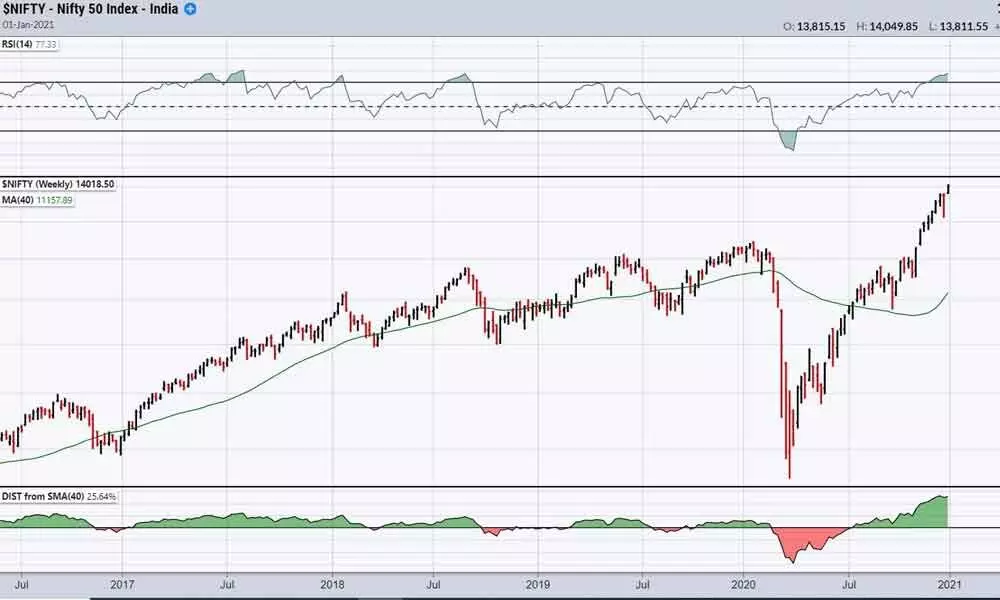
The Indian markets hit lifetime highs each day during the last week and closed at a new high. The liquidity support maintains the trend intact. The benchmark index, the Nifty, gained by 269.25 points or 1.96 per cent during the last week. BSE Sensex gained by 1.9 per cent.
The Indian markets hit lifetime highs each day during the last week and closed at a new high. The liquidity support maintains the trend intact. The benchmark index, the Nifty, gained by 269.25 points or 1.96 per cent during the last week. BSE Sensex gained by 1.9 per cent. The broader indices Nifty Midcap-100 and Smallcap-100 outperformed with 3 per cent and 3.9 per cent respectively. On the sectoral front, all the sectors registered decent gains. The Nifty PSU Bank index gained the most by 6.2 per cent. Reality sector up by 5.7 per cent and metal, auto sectors advanced by 3.6 per cent and 3.3 per cent respectively. The broader market participation and positive breadth is the main driver for the market. FIIs invested a massive Rs. 128,078.47 crore in India equities in the Oct-Dec quarter, which is the highest ever.
We have entered in the new year. In the past two decades, nine market tops made in January, 4 in February and 3 in March. Out of 20 years, 16 tops were in the first quarter of the calendar year. In 2006 the top was made in May, in 2014 it was in December, in 2017 in September and in 2019 it was in June.
NIFTY 50 historical study shows that over the last 30 years the Disparity index (a name borrowed from Steve Nison), the difference between the 10-week Moving Average and the closing price, recorded extreme readings of over +1500 & -1500 just four times.
The first was an extreme high in Oct 2007 and a couple of months later the market crashed about 65 per cent. The low of that crash coincided with an extreme negative reading below -1500 during Oct 2008. Since that time market made multi-year rallies, with some significant corrections in between of course.
The third extreme reading was again a negative one below -1500 during Mar 2020, as a result of the near 40 per cent crash. Following this extreme reading over -3000 (the lowest ever in the last 30 years) market rallied sharply, 87 per cent as of date, pushing the indicator to its highest extreme ever, over +2300. Now what can we expect? A repeat of 2008 / 2020 like mayhem? Or a longer-term bear market? Only time can tell! Please note that the early 2020 crash that is still very fresh in our memory did not have any prior extreme readings like the current level or that of 2007.
Whatever be the final outcome, these extreme readings make me cautious, very cautious (though not nervous yet). Personally, I am preparing for scaling out positions and getting ready to race out the door at the first sign of a sell-off.
After 2008 fall, the PBV was never above 3.9 per cent. The current PBV is at 3.97 per cent. The Nifty is trading at a trailing PE of 27.7 and a forward PE of 22. The consensus EPS for Nifty PE for FY 22 is at 670 and for FY-23 is at 809. Even at this rate of earnings also the Price-Earnings at an over value zone. The important factor in gauging the fundamental strength is Return on Equity. As CANSLIM follower, 17 per cent above is suitable for any investment decision. The current Nifty RoE is at 9.63, is lowest in the decade. These fundamental factors show that the market is trading on stretched valuations.
(The author is a financial
journalist and technical analyst.
He can be reached at [email protected])


