Market activity shifts to stock-specific trade

Market activity shifts to stock-specific trade
x

Market activity shifts to stock-specific trade

Highlights

Nifty continues to be in overstretched zone, as majority of indicators are in overbought condition

The stock market traded with wavering behaviour last week. It opened with a gap up on Monday and traded in a range. The benchmark index, the Nifty rose by 239.05 points or 1.60 per cent during the last week. The Sensex also up by 1.6 per cent and settled at 51544. The broader indices Nifty Midcap-100 and Smallcap-100 outperformed the benchmarks with 2.18 per cent and 3.85 per cent respectively. The much broader index represents 90 per cent of the market capitalisation Nifty-500 index is up by 1.86 per cent. During the current month, the FIIs bought Rs.19,466.41 crore worth of equities, and the DIIs sold Rs. 10,354.68 crore.

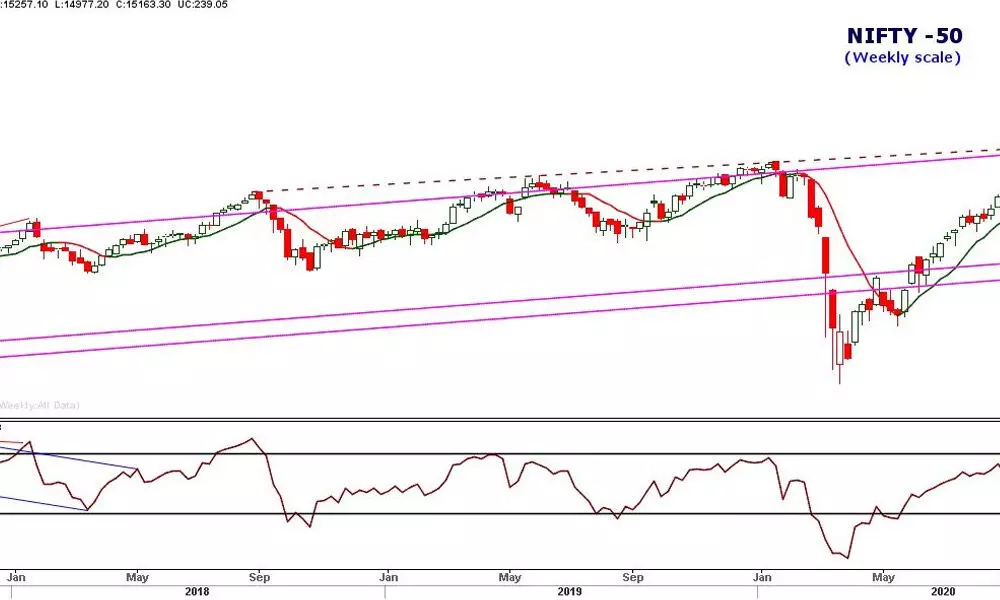
The Nifty formed a small body candle, looks like an evening star or a spinning top. After a euphoric move of ten per cent after the union budget, the market is hesitant to move further highs. The market activity shifted to the stock-specific, particularly small and micro-cap stocks. In the majority of large stocks looks tired, and forming an indecisive or bearish formation. After opening on an enthusiastic note with a gap up on Monday, it filled the Wednesday gap. Reached a new high of 15257 on Tuesday reacted downside sharply for two days. The entire week's movement is limited to these two days range. It is a general phenomenon that, after an exuberant move, the price generally consolidates for some before moving further.

The Nifty facing resistance at the channel upper trend line and moving around the line. As the supply is higher, the market failed to close above the channel resistance line. After doubled from the March low, the index is hovering around it. The major index drivers, SBI, and other private sector banks are consolidating. The Pharma, Metals and Auto sector indices formed bearish candles. Only two sectors, PSU Banks and Realty, are in leading quadrant and those two also moving towards weakening quadrant. Interestingly the new sector moved from lagging quadrant directly to the leading quadrant is Auto. This scenario indicates that the sector rotation is perfectly going on.

Technically, the evening star candle at a high is a bearish formation, if the next opens with a gap down and closes in the negative zone on a weekly basis. As in the recent past, such several bearish formations failed to get the confirmation. For major downside move or reversal signal, the Nifty must close below the 14977. Nifty continues to be in an overstretched zone, as the majority of the indicators are in an overbought condition. The RSI is above 73 zone, and the signs of negative divergence is emerging. A decline below the 14977 will confirm the divergence implications.

The MACD is above the signal line shows the bullish momentum as the price closed higher on a weekly basis. But, on the daily charts, the momentum has declined. For the last three days, the 5 EMA acting as support, and a close below 15087 on Monday, is the first sign of weakness. The next level of support is at, Wednesday's low of 14977. Moving below these levels meant the Nifty might test the 20DMA of 14585. On this upside, moving above 15257 or close above 15190 is a positive signal for the near-term.

(The author is a financial journalist and technical analyst. He can be reached at [email protected])

Show Full Article
Print Article
Next Story
More Stories
ADVERTISEMENT
ADVERTISEMENTS