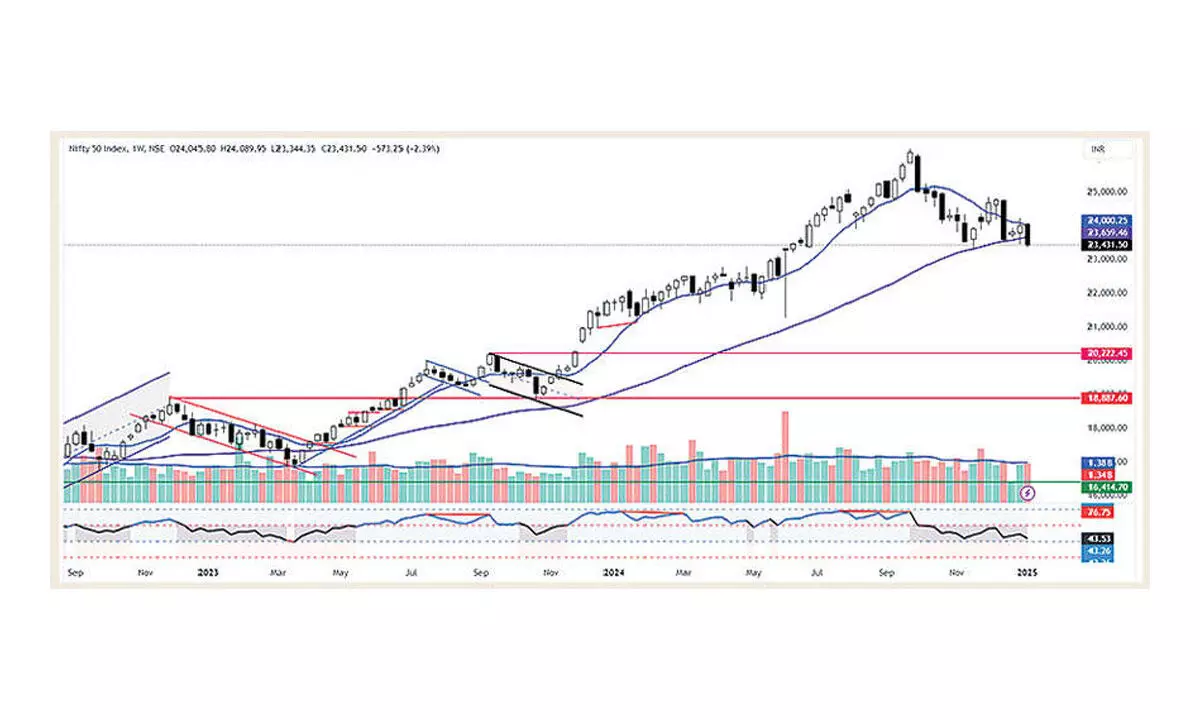
MACD line hovering in bearish zone

he equities continued downtrend and closed below the key supports. Barring IT, all the sectoral indices registered declines
The equities continued downtrend and closed below the key supports. Barring IT, all the sectoral indices registered declines. NSE Nifty is down by 2.39 per cent, and the BSE Sensex declined by 2.33 per cent. The broader market indices, Nifty Midicap-100 and Smallcap-100, declined by 5.77 per cent and 7.29 per cent, respectively. The Nifty IT index is up by 2.02 per cent. The PSU Bank index slipped by 8.07 per cent. The Realty index declined by 7.83 per cent. The market breadth is negative throughout the week. The India VIX is up by 10.16 per cent to 14.92. The FIIs sold Rs21,357.46 crore, and the DIIs bought Rs24,215.46 crore worth of equities. The benchmark index extended the downtrend after two weeks of pause. It broke the key supports. The Nifty decisively closed below the 50-week average with high volumes. On a daily chart, it made another minor lower low and broke the rising trendline support. Importantly, the index registered the lowest closing after June 13. The week began with a sharp decline of 389 points, which violated the 200DMA. Now, the index is 2.13 per cent below this long-term average. The 50DMA came closer to the 200DMA, and further decline will result in a death-cross.
The 19th December gap down area 24,149-24,065 has become an important resistance area now. The 50DMA is also placed at 24,054 points. The 2nd January breakout of this was not fruitful and declined sharply. Only above this level (24,267) will the index form a higher high, which is a reversal sign. Before this, the index has to clear several resistances, including 200DMA and 200EMA. The last seven days’ decline with high volume indicates intense distribution.
As suspected, Q3 earnings have not been encouraged to date. The TCS positive commentary was a big boost for the IT sector, though it missed an estimate on revenue. This may lead to further selling pressure in the market. Only the Nifty IT index looks good technically. After last week’s fall, the broader market indices, Midcap, Smallcap, and Microcap, closed at the key support. As they formed a double-top pattern, any further decline will result in a breakdown. The rupee depreciated further against the dollar at Rs86.15.
(The author is Chief Mentor, Indus School of Technical Analysis, Financial Journalist, Technical Analyst, Trainer and Family Fund Manager)


