Live
- Surprising Health Benefits of Eating Sprouts
- Purandareswari Emphasizes Cultural Education at YN College Diamond Jubilee Celebrations
- Andhra Pradesh Real Estate: Emerging Cities to Invest in 2025
- National Youth Day 2025: Celebrating Youth Empowerment and Swami Vivekananda’s Vision
- Today's Horoscope for January 10, 2025: Unlock the Powerful Daily Insights of Your Zodiac Sign
- Bengal fake passport racket: Role of verification officers under scanner
- SC stays GST show-cause notices to online gaming sector in temporary relief
- Sambhal mosque row: SC stays implementation of notice relating to well
- SS Rajamouli Unveils India’s First Dolby Certified Postproduction Facility for Cinema & Home at Annapurna Studios
- Divi turns heads with a bold look
Just In

After witnessing a 296-point volatility in just four trading sessions, Nifty lost 66.20 points or 0.60 per cent last week. The Sensex closed 0.9 per cent lower.
After witnessing a 296-point volatility in just four trading sessions, Nifty lost 66.20 points or 0.60 per cent last week. The Sensex closed 0.9 per cent lower.
Despite the series of stimulus measures by the government, market sentiment did not improve. FIIs continue to sell heavily in the equity market. They sold Rs 5272.91 crore worth of shares just in four trading sessions in September.
With positive news flow, the Nifty metal index gained 3 per cent and the Auto index rose by 1.3 per cent. Nifty PSU Bank index was down by 3.8 per cent and FMCG index fell 2 per cent.
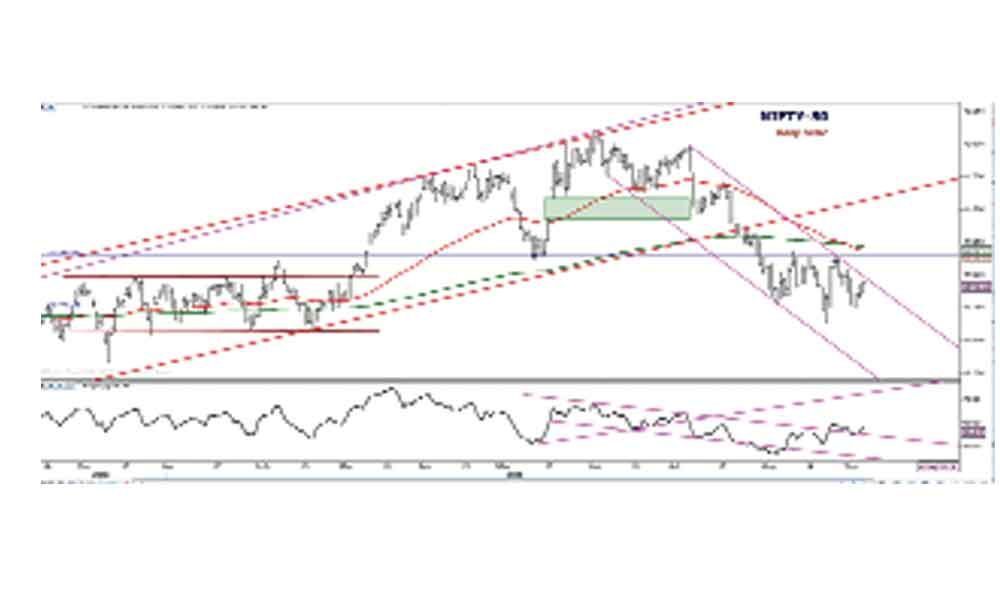
Nifty is still moving in a downward channel but has not made any lower low or a higher high.
Barring August 23, Nifty is moving in 10746- 11146 range for the past 21 trading sessions. It looks like forming inverted Head and Shoulder at the bottom with a neckline at 11146. There is a lot of symmetry between the two shoulders.
When it closes above 11146 levels, the inverted head and shoulder breakout will happen. As I mentioned earlier, Nifty will move up to 11468-11540 only after it moves above 11146-11181 level.
However, before breaking the probable inverted head and shoulder, the Nifty needs to break the downward channel. Even though Nifty is making higher lows and highs for the past three days, the volumes are not improving.
Interestingly, the death cross happened on a weekly chart. The 10-week average cross is under the 40-week average. Even on daily chart, 50EMA cross is under the 200EMA.
This is not a good sign for bulls. And Nifty formed dragonfly doji or hammer kind of pattern on a weekly chart. Nifty closed above the short-term moving averages 5 and 8 EMAs. But it was unable to move above 20DMA.
Most importantly, Nifty did not retrace even a minimum of 23.6 per cent of a fall from 3rd June High to 29th August low. The retracement level is placed at the channel resistance line of 10,983. Even the long-term trend of the last 10 year is also broken.
In this scenario, every pullback is attracting fresh selling. There are short positions in the market at historically higher levels. For the last two weeks, Nifty is trading within the prior week low.
This back to back inside bars are rare in nature like last weeks hammer candle in all time frames. In this consolidation pattern formation period, the MACD line is above all the formation time and the RSI is moving in an upward channel by making higher highs and higher lows.
These indicators are giving a positive future in the zone. Another major index, the most liquid BankNifty is still making lower highs and trading below the short-term moving averages. There are no positive divergences visible.
With this technical evidence, better avoid any kind of aggressive positions. So long as the Nifty trades within the range, aggressive positions will hurt Investors on both sides.
If Nifty breaches on either side, the move will be a sharper and euphoric on either side of the move. Wait for a breakout or a breakdown for a big move.
(The author is a financial journalist and technical analyst. He can be reached at [email protected])

© 2025 Hyderabad Media House Limited/The Hans India. All rights reserved. Powered by hocalwire.com


