Go for stock-specific approach

Go for stock-specific approach
Equity benchmarks were higher for the seventh consecutive week. The Nifty gained 246.7 points or 1.83 per cent during the last week. BSE Sensex was also up by 1.87 per cent.
Equity benchmarks were higher for the seventh consecutive week. The Nifty gained 246.7 points or 1.83 per cent during the last week. BSE Sensex was also up by 1.87 per cent. With the expectations of the US stimulus package and the Covid vaccine, news flow improved the sentiments in the market. At the same time, unabated FII flows into the domestic market supported the rally to continue. The boarder market indices moved in tandem with the benchmarks. IT and pharma led the market rally during the week. FIIs pumped Rs 38,734.10 crore in December so far, while DIIs sold Rs 29,651.18 crore worth of equities.
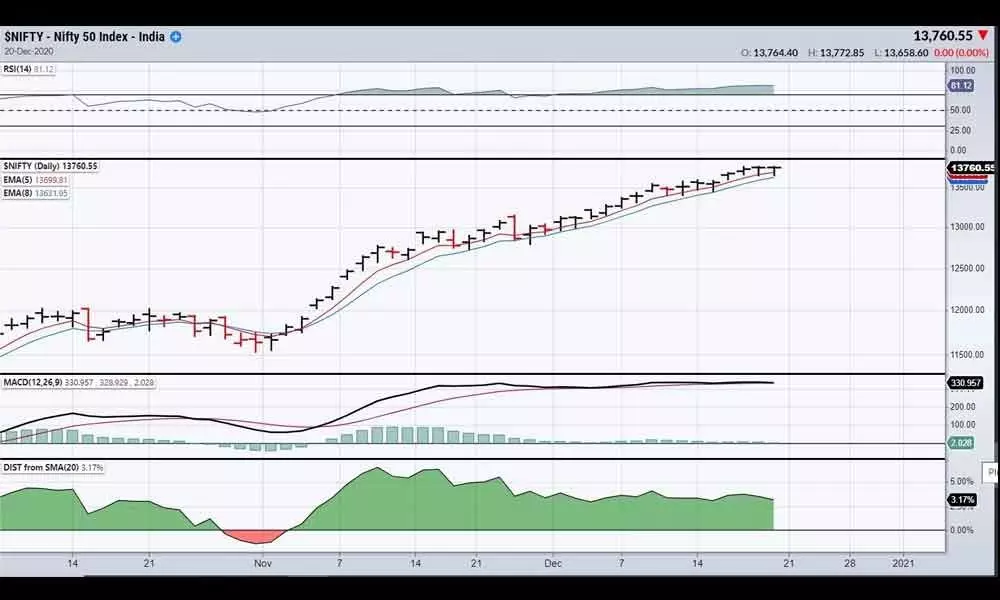
The Nifty formed another bullish candle on a weekly chart. It recorded all the positive days during the week. Even though it formed an indecisive Doji candle every day, every dip was used as a buying opportunity. The bias is still on the upside as a majority of the bars have long tails at the bottom, indicating buyer dominance, howsoever marginal that may be. The liquidity continued to pour into the market as there are no fresh negative triggers. The market retraced to 127.6 per cent of the previous fall and met the target of 13,788 almost on dot. The coming four-day week may lead to consolidation or more range-bound trading. The Nifty sustains above the short-term moving averages, 5EMA and 8EMA.
The support level inched up to the 13,669 and 13,595. Unless these levels are broken on a closing basis, the rally continued to be in motion. The Nifty continues to trade over 26 per cent above the 200DMA. The distance from the 20DMA is coming down. It is an indication of consolidation on the cards. The leading indicator RSI is in the extreme overbought condition in daily and weekly timeframes. It may remain in the overbought condition for some more periods unless the Nifty breaks the key supports. The MACD histogram is crawling on the zero line, indicating a lack of momentum. The MACD line and the signal line moving in a straight-line fashion is showing the overextended nature of the market. Weekly bars and weekly MACD show the consensus bias on the direction of the market. The ADX shows the extraordinary strength in the trend as it was in peaks. The positive momentum indicator is declining because of the indecisive bar on the price.
For the last seven days, the Nifty is forming identical indecisive candles, but failing to get the confirmations for a reversal. A Doji candle at the lifetime high requires the next candle closing below it for a reversal. These indecisive candles are not giving intraday opportunities. On a 75-minute chart, the Bollinger bands contracted and indicated an explosive on the cards. A close below 13,600 will create short euphoria on the downside. In these conditions, continue the long positions with a trialling stop loss, and get ready for an unexpected move.
The Nifty price earnings reached to 37.84, the highestever level ever. Even if the earnings grow at a double-digit rate, the rally may not be sustained. It may correct to a reasonable valuation zone. The sector rotation is perfectly going on and the traditional defence sectors like FMCG, pharma and IT indices were in the limelight last week. It would be prudent to approach the markets in a high sector- and stock-specific manner. Adopting such an approach will help mitigate risks in the event of any broad consolidation happening in the markets. While avoiding both shorts and excessive leveraged exposures, a highly selective approach advised over the coming week.
(The author is a financial journalist and technical analyst. He can be reached at [email protected])


