Counter trend swing may continue

Counter trend swing may continue
x
Highlights

The equities traded in up and down swings last week, with some strong and indecisive bars

The equities traded in up and down swings last week, with some strong and indecisive bars. NSE Nifty traded in the 336-point range and closed with 183.35 points or 0.96 per cent gain. BSE Sensex is also up by 0.91 per cent. The Nifty Mid-cap and Small-cap indices outperformed with 2.29 per cent and 2.58 per cent, respectively.

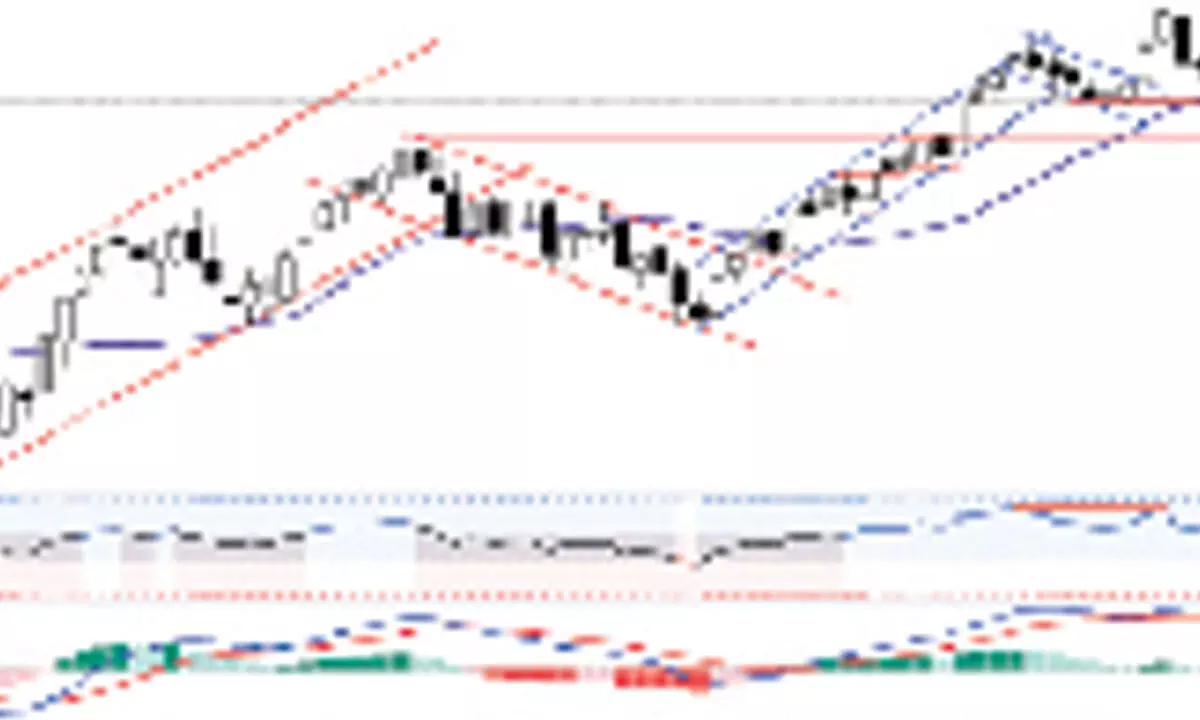
On a sectoral front, only the Nifty Auto index is down by 0.77 per cent. The Nifty Realty is the top gainer with 10.42 per cent, followed by the Nifty Media index with 3.96 per cent. In the last three sessions, FIIs sold Rs3,064.50 crore, and the DIIs bought Rs1,871.53 crore worth of equities. The counter-trend consolidation was a reality, as mentioned in the last column. For the last six trading sessions, the Nifty is moving in a counter-trend consolidation, or a Flag pattern. During the consolidation, the volumes were below the average. It formed an inside on a weekly chart. Normally, the counter-trend consolidations end at 38.2 per cent or 50 per cent retracement levels.

The Nifty closed at the 38.2 per cent level at the end of the week. The last two days of price action were indecisive, though it registered the gap-up openings. The index has formed two consecutive Doji candles. The bounce was, after testing the November 2022 high, completed the throwback. This is another reason for the pullback. Now, the 18,837-887 zone will be crucial support for the short term. As long as it trades above this zone, the market is in a rally attempt mode. Expect another two days of positive bias, as the counter-trend swings last for 6-8 days.

On the upside, the 19,343 level, which is a 50 per cent retracement level of the previous downswing, is the immediate resistance. In the most bull case scenario, the Nifty will test 20DMA (19430) and the 61.8 per cent retracement level (19463). The 20-week average is also near this zone at 19,482 level. The Nifty is still 1.69 per cent below the 50DMA. Both the 20 and 50DMAs are in the downtrend. With the bounce in the index, the MACD histogram shows a decline in momentum. The RSI came out of the oversold condition and in the neutral zone. Watch RSI around the 50 zone.

(The author is Chief Mentor, Indus School of Technical Analysis, Financial Journalist, Technical Analyst, Trainer and Family Fund Manager)

Show Full Article
Print Article
Next Story
More Stories