24,414 may act as strong resistance

NSE Nifty erased all the initial gains and retraced above the crucial levels.
NSE Nifty erased all the initial gains and retraced above the crucial levels. The Nifty gained by 1.59 per cent. The BSE Sensex is up by 1.98 per cent. The broader market indices, Midcap-100 and Smallcap-100, were up by 1.80 per cent and 0.88 per cent, respectively. On the sectoral front, the Nifty Auto is up by 2.79 per cent. The IT and FMCG rose by 2.22 per cent and 2.10 per cent, respectively. On the flipside, the Nifty Media is down by 1.63 per cent. The Market breadth was mostly negative. The FIIs sold Rs40,947.35 crore, and the DIIs bought Rs37,559.08 crore worth of equities this month.
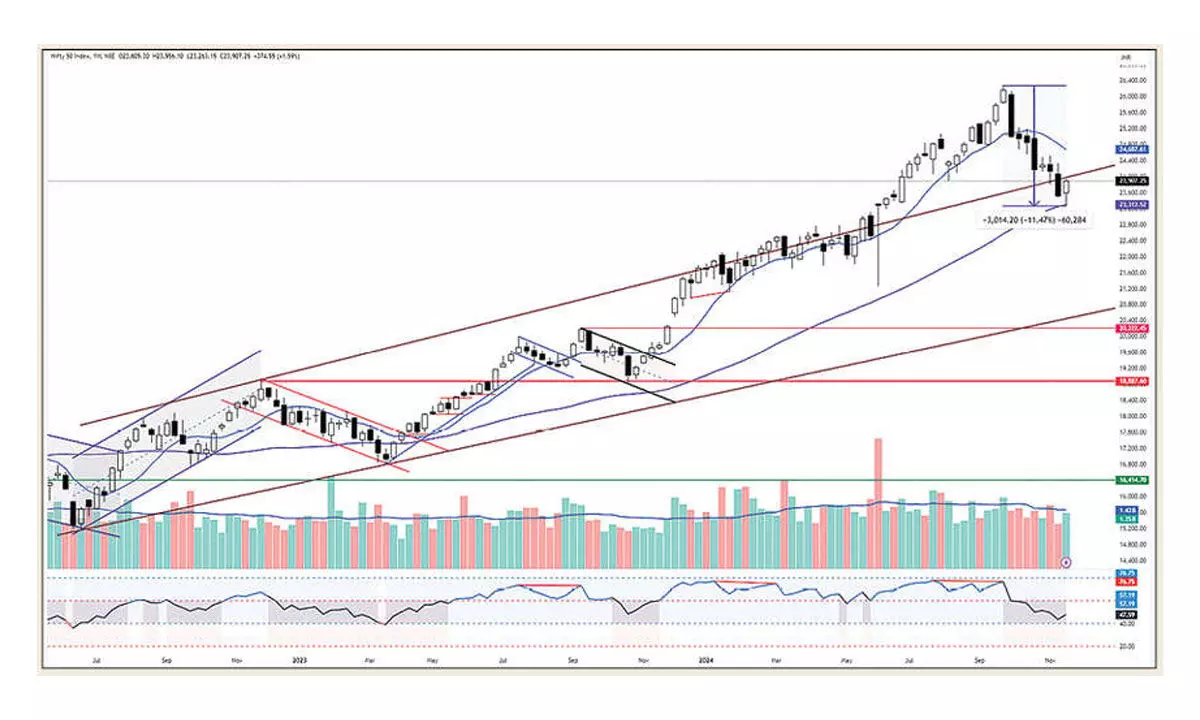
With a sharp bounce of over 557 points or 2.39 per cent on Friday, the Nifty is back above the 200EMA and 200DMAs. It took support on the 50-week average and formed a hammer candle, which indicates a probable reversal if it closes positive next weekend. The Volume was higher than the previous week, showing increased buying interest. But, on a 2.39 per cent bounce on Friday, the volumes were lower than the previous day. This volume divergence is the result of some uneven price movements. As the new F&O rules came into force, the rollovers were very few, which means traders were not interested in continuing the positions for the next month. In other words, over two per cent of the rally on Friday was caused by short covering.
The Nifty ended its seven-week declining phase. But to get the reversal signal, the index must close above 23,956 to get the confirmation for the Hammer candle or bullish reversal. The 23.6 per cent retracement level of the prior fall is at 23,974. A close above this zone will result in counter-trend consolidation for the next three to five weeks. Normally, the counter-trend consolidations retrace 50 per cent to 61.8 per cent of the prior fall. This zone of resistance is at 24,770-25,126, a long way to go. Before this zone, the index must close above the 20DMA of 24,031 and the 30-week average of 24,192. A close above this zone will also result in the confirmation of the probable consolidation.
The benchmark index closed at a six-day high and formed a strong bullish candle. It closed above the 8EMA, a short-term resistance. It came closer to the 20DMA. Now,, the distance from the 50DMA has shrunk to 3.52 per cent from 5.86 per cent in just one day. This is part of mean reversion. The price will not sustain if it moves far away from the average. Even before the current fall, the index moved far above the average.
During the previous pullbacks in the current downtrend, the Nifty is up by 2.19 per cent and 3.03 per cent. Friday’s pullback is 2.98 per cent. As the Maharashtra elections were favourable to BJP, the market may react positively on Monday. But the question is sustaining above the 20DMA of 24,031. If the rally continues, the 38.2 per cent retracement level is at 24,414, which may act as a strong resistance. Even though the bounce was very strong on Friday and may continue on Monday, the reversal signal is yet to be confirmed. The index has to defend the 50-week average support of 23,312 on a weekly closing basis. The index must form a base above this zone, and on a breakout, we may get a good buying opportunity. On a rally, protecting profits must be the priority of trade.
(The author is Chief Mentor, Indus School of Technical Analysis, Financial Journalist, Technical Analyst, Trainer and Family Fund Manager)


